
Understanding Inflation in India
In this post, we look at inflation rates in the Indian economy. Inflation is commonly understood as tendencies of prices of goods and services to increase over a period or year or year. Inflation erodes the purchasing power of money – this means that amount of goods and services that can be purchased one year from now would be less than the number of goods and services that can be purchased today with the same amount of money. This has an implication for investments – investors not only want to be compensated for postponing their purchases by giving the amount away in investment but would also expect to be compensated for the loss of purchasing power because of inflation.
There are multiple causes of inflation. The government is always borrowing money to bridge the gap between its expenditure and its income. A part of this gap is filled by printing money. Printing money introduces fresh money into the system and now more money is chasing the same amount of goods and services. Another reason could be a high growth rate in the economy that increase the income level of households. With increased income levels, households demand more goods and services than they consumed earlier. Since the production of additional goods and services can’t catch up immediately – new production factories need to be set up to produce more detergents and cars, for example – a price level increase. A third cause, which is more negative, is supply shock – there are bottlenecks in supplying goods already produced. Such supply shock can take the form of the inability to move products across various states because of the VAT regime, hoarding by producers and middlemen, disruptions in transport networks, or disruption in international trade because of which raw materials are needed to produce goods are not available easily.
“When the growth rate in an economy is high, mild inflation is a natural thing to happen and is even considered healthy. If inflation rates are high, many asset classes like cash held in bank deposits lose value rapidly.”
When the growth rate in an economy is high, mild inflation is a natural thing to happen and is even considered healthy. If inflation rates are high, it causes serious disruption in the economy and political environment. In times of high inflation, investors expect more interest rates to compensate for a higher loss of purchasing power. High-interest rates provide a disincentive for industries to borrow money, either for working capital or to set up new production facilities. High inflation thus leads to a contraction in industrial production. Historically, persistently high inflation rates have also resulted in regime change or changes in government in many countries.
Inflation is an increase or change in the price level. Change in price levels is difficult to measure. Changes in price levels are generally measured as how much it would cost to buy a fixed basket of goods and services today as compared to last month or last year. The next question that arises is what the basket should consist of – should it include only groceries and gas bills or should it also include two-wheelers, petrol, other white goods, and cars. What about including rent, the cost of buying a house, and medical bills? Price levels in a city, in a semi-urban center, and in a village, only 50 kilometers from the city would be different so which price should be taken for calculating the inflation rate…
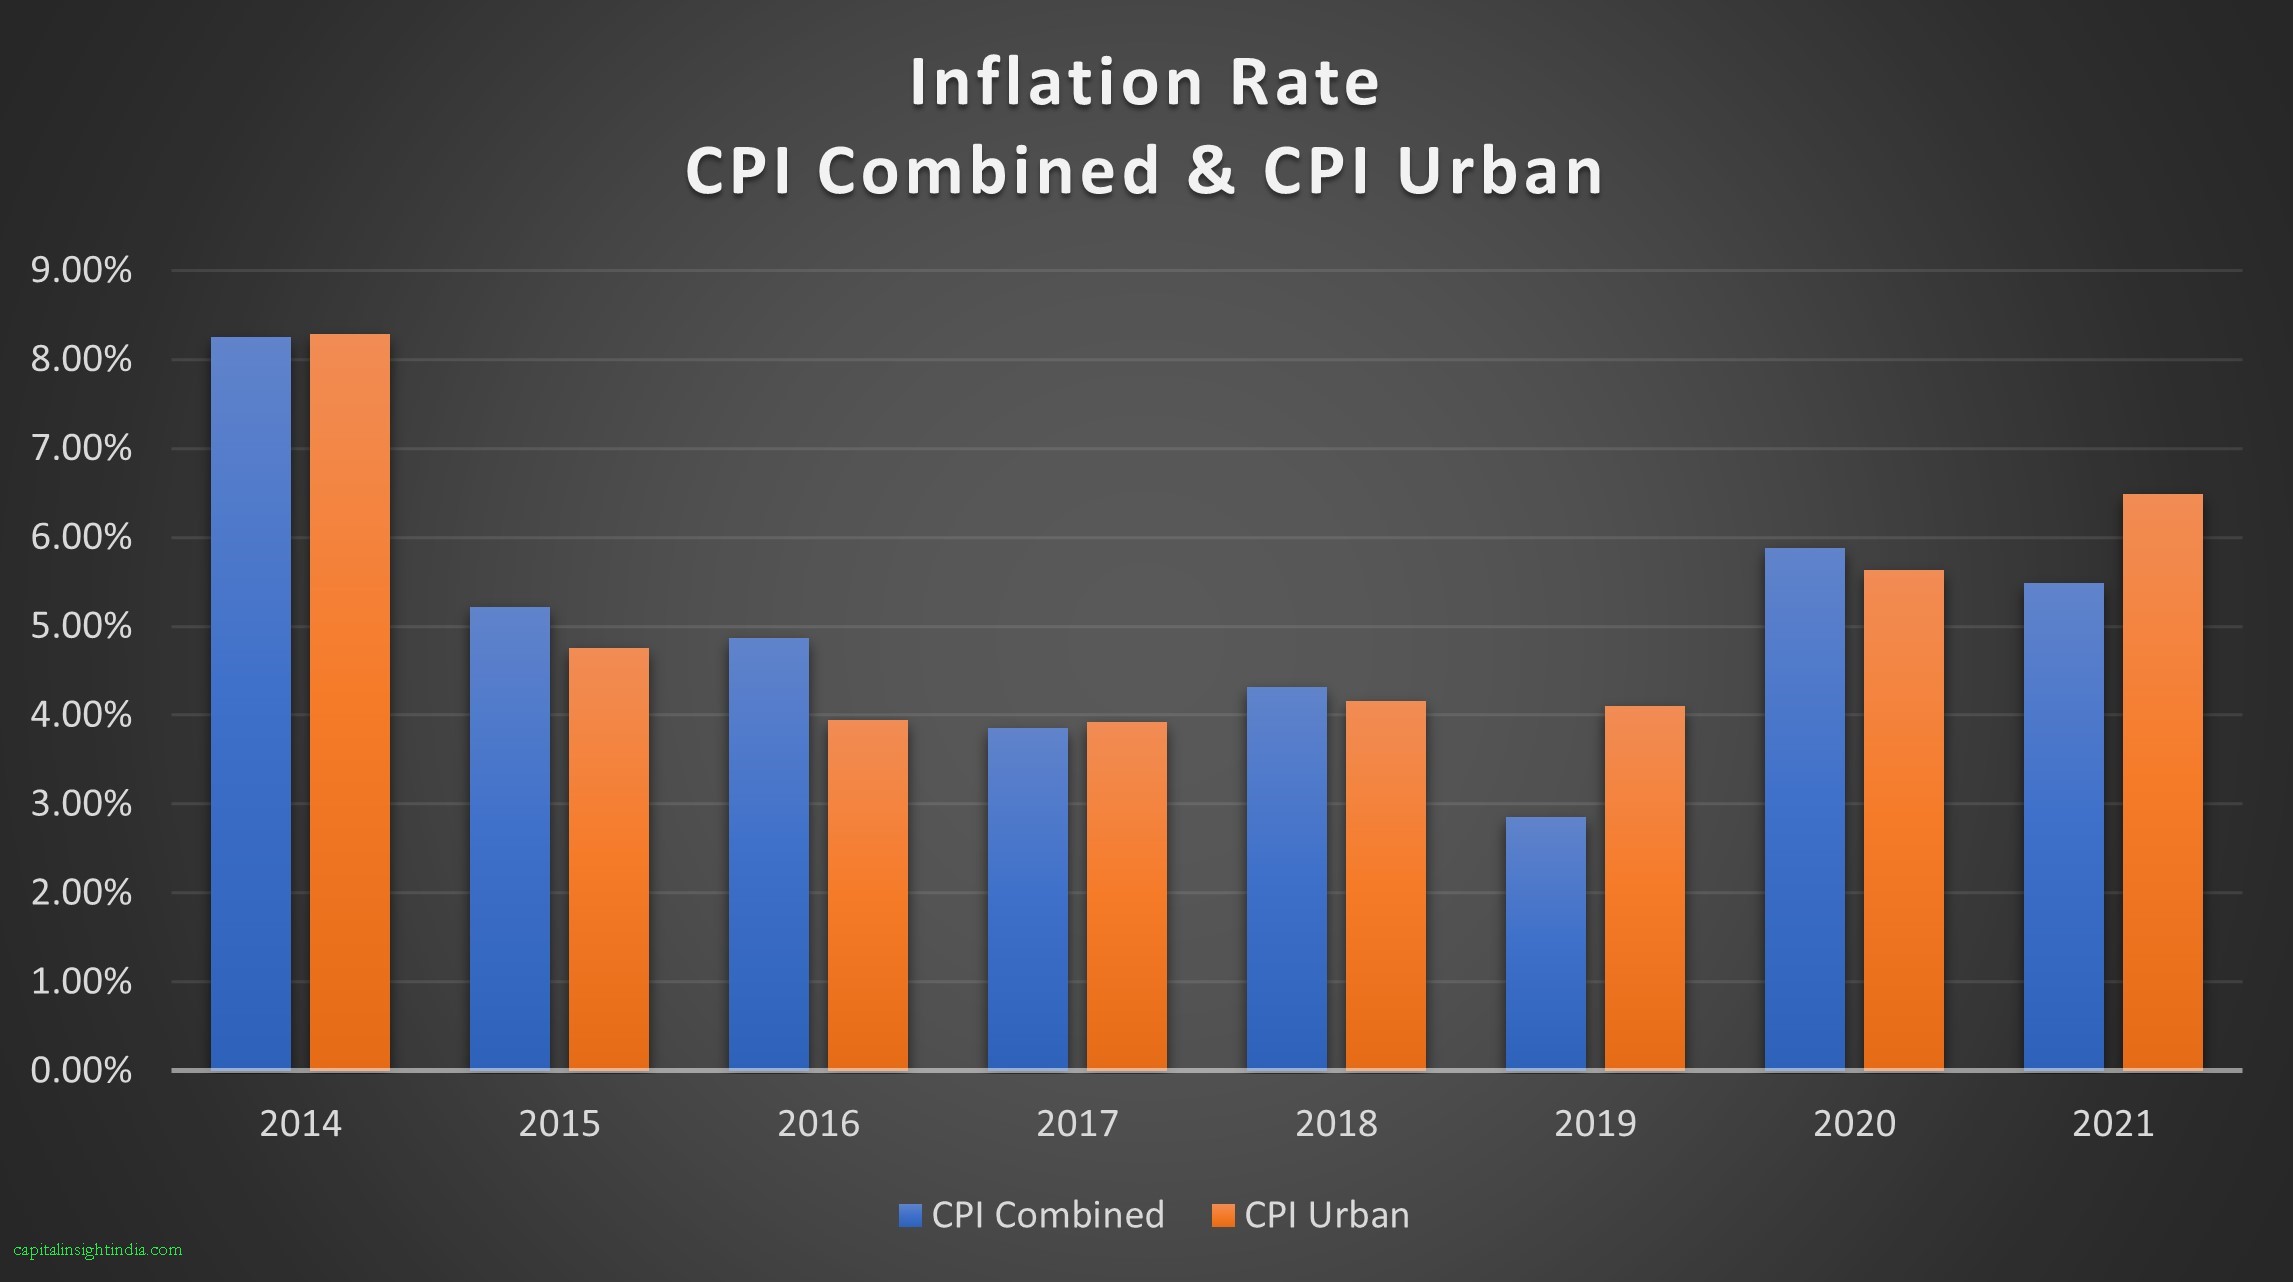
The answer is not straightforward. In India, there are multiple price levels – consumer price index for rural workers, consumer price index for industrial workers, consumer price index for urban consumers, wholesale price index, etc. These price indices don’t include items like the price of a house, two-wheelers and medical costs, etc. Rather they focus on only those items that are used in the day-to-day life of a broad spectrum of relevant consumers. So these series do not reflect the changes in price levels for things like white goods, cars, houses, medical expenditures, etc. In this post, we presume that most of the readers would be urban consumers. So we use two inflation rates: the Consumer Price Index for Industrial workers for which data is available from 1970 and the Consumer Price Index for Urban Consumers which is a new series started by the Reserve Bank of India in 2012. The data source for both series is the public database being maintained by the Reserve Bank of India – the DBIE.
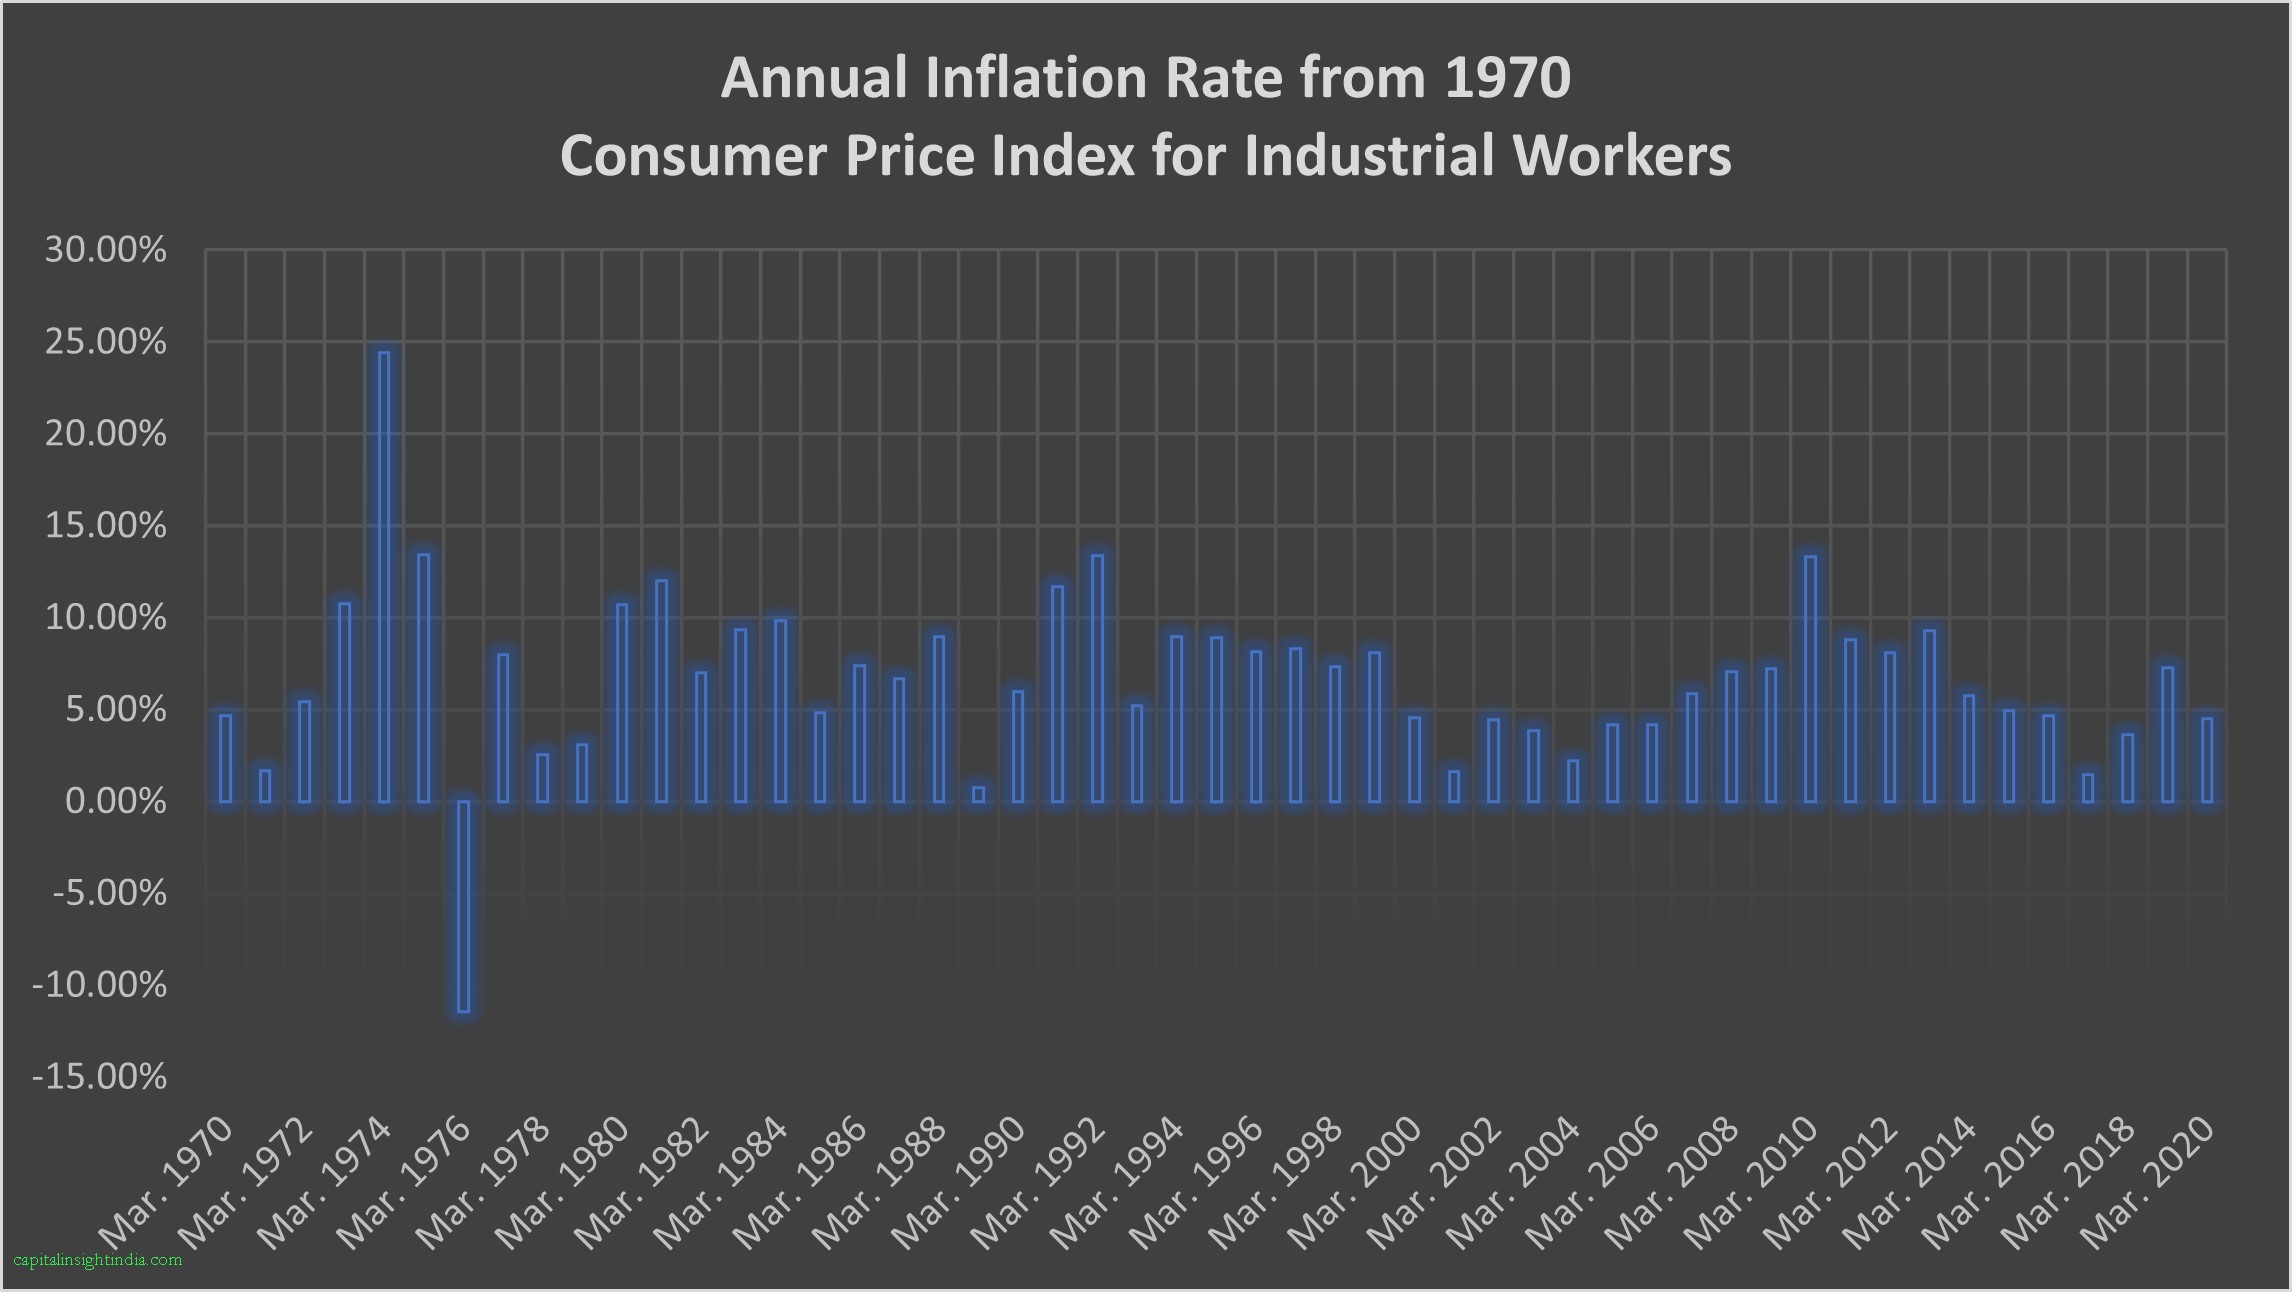
In this chart, we track the changes in the price level, which is also known as the inflation rate, from 1970. We see a high inflation rate of 25% in 1974. We also note a negative inflation rate of 11% in 1976 – this is the time of emergency when erstwhile Prime Minister Indira Gandhi embarked on the first demonetization and took drastic steps to reduce the inflation rate. This period in the economy was full of supply shocks, and hoarding and black marketeering were common. Other than these two years, the peak inflation rate that we experience from time to time is around 10% followed by a low inflation rate of 1-3%. Note that inflation rates are in cycles – inflation rate falls from peaks slowly over the years, and once it reaches a low point, it rises slowly over the years to a high level. High inflation rates are experienced when the economy is heading towards a high growth rate and the inflation rate falls as the growth rate slows down. For example, inflation was low at around 2% in 2001 when the economy was not performing well, reached a high of 13% to 9% in 2010-13 when the economy was performing very well, and reached a low of 1% to 3% again in 2017-18 when there was a slowdown in the economy.
The average inflation rate between 1980 to 2020 is 6.84%, between 1990 and 2020 is 6.55% and between 2000 to 2020 is 5.57%. These should be our working inflation rate numbers for investment.
These rates cover the price level of only the basic and day-to-day items. What about white goods, cars, and houses. A Maruti car cost Rs 48,000 in 1982. A similar entry-level Maruti Alto cost Rs 294,000 in 2020. This gives us an inflation rate of 4.88%, quite close to the inflation rate we noted in CPI. Similarly, a Sony Bravia television cost around Rs 5000 in 2003, and an entry-level Sony LCD TV costs Rs 15,000 in 2020, an inflation rate of 6.69%. Again, this is quite similar to CPI. But consider this: a person driving a Maruti Alto, that costs Rs 294,000 in 2020 would like to move up in life and would like to drive a bigger and better sedan or SUV that may cost Rs 10 lakh, then inflation works out to a whopping 27%. This is purely ‘self-inflicted’ inflicted’ inflation – the person need not spend this amount at all if he chooses to. This is called lifestyle inflation.
The repeated inflation figure between 5% to 10% that we noted above hides another important fact. We grow technologically all the time. Between 1982 and 2000, we had mobile phones, air travel, a wider variety of cars, and better quality international white goods brands being introduced into our economy. Between 2000 and 2020 we had an explosion of laptops, desktops, smartphones, smart homes, etc. A person who is not living a rural life would need to buy these items. While the price level of these items may grow by only 6% every year, the number of such ‘must have items’ increases dramatically every five years or so. This introduces another type of lifestyle inflation that may be higher than the 27 % calculated earlier.
“In lifestyle inflation, expenditure has increased not because prices of goods have increased but because the desire to own more luxury goods has increased.”
The same is the case with medical expenditure. Medical costs are known to grow at a much higher rate than 6% indicated by CPI. Depending upon the care one wants to receive, the medical costs shoot up not only because of technological advancements in medical procedures, and medical tests but also because age-related factors increase the medical attention required. In other words, if we hold the cost of medical care as constant, one’s medical expenditure would still go up as one grows older – the aging process itself brings in diseases that require costly medical attention. One can easily expect medical inflation to be in the range of 30% at a decent hospital in an urban center.
With real estate inflation, similar consideration applies. World over, inflation in land and house prices follow a wider benchmark like CPI but with a slight difference. Land and house prices run up dramatically for a few years at the beginning of the cycle when the economy is doing well. After that, it stagnates for several years or even falls. So during the run-up period, prices would seem to be increasing at a much faster rate than the inflation rate.
When the prices stagnate after a run-up, time value starts to catch up and the inflation rate falls even without prices falling. So when we calculate the long-term inflation rate in real estate, it comes closer to the common inflation rate benchmark. The consideration of lifestyle inflation, however, applies. Not only do people want to move to a bigger house, but they also want to move to a better location. So the inflation rate experienced by the individual is much higher.